The Maths Police Investigate: IndyRef edition
Gale surveyed the destruction with a face somewhere between disgust and admiration. Tunnock’s Caramel Wafer wrappers strewn across the room. A smell of haggis in the air. Bottles of whisky, half-drunk. Constable Beveridge… well, you wouldn’t say half-drunk.
“You were up watching the referendum results last night, weren’t you?”
Beveridge looked out forlornly from under his See-You-Jimmy wig and croaked “Not so loud, pal.”
“Sorry,” whispered Gale. “Let’s have a look at those results.”
Beveridge, apparently, would have walked five hundred miles.
“Good grief!” yelled Gale, thoughtfully handing Beveridge a can of Irn-Bru. “It was a landslide for reddish-pink!”
[caption id=”attachment_4196” align=”alignright” width=”249”]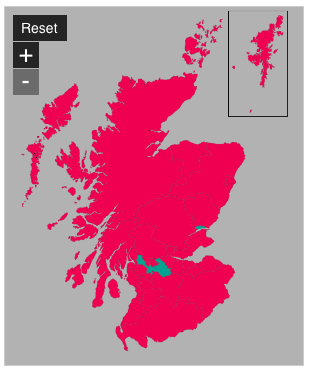 A landslide for reddish-pink[/caption]
Beveridge swigged from the can, transformed into something resembling a human being, and looked at the map. “This stuff goes straight to your head!” he said. “Jings crivens! That’s not what I dimly remember at all!”
“How do you mean?”
“Nearly 45% of the electorate voted aquamarine - but that looks like… well, the total area of Dundee ((55km²)), West Dunbartonshire ((176km²)), Glasgow ((175km²)) and North Lanarkshire ((476km²)) is 882km², compared to the whole of Scotland (78,387 km²)…”
“You just happen to know that, do you?”
“There was a lot of time during the coverage where they were just speculating. What would you expect me to do? Listen?!”
“No, I’d expect you to memorise Scotland facts off of Wikipedia.”
“Precisely. So they’ve coloured 1.1% of the area to represent 44.7% of the people. That’s a Lie Factor of over 40.”
“A lie factor?”
“Yes, that’s the new statistic we use to say how bad a graph is. It’s the ratio between the size of an effect in real life and the size of the effect on the graph.”
“I like it. So, how can they even start to justify this monstrousness?”
Beveridge paused for a moment. “Oh, not monstrous Ness. Right, they’ve used two misrepresentations for the price of one. The first is the population density effect: Highlands, for example, has an area of 26,000 square kilometres, and a population of about quarter of a million - nine people per square kilometre. Glasgow, by contrast, has nearly 600,000 people crammed into 175 square kilometres - 3,390 people per km².”
“So Highland looks more than 100 times more important as Glasgow - but in election terms, it’s less than half as important.”
“Exactly. But there’s more: in a general election, where it’s winner-takes-all in each seat, it makes sense to colour each seat the same colour. But in a referendum…”
“You need to show the proportion of votes, not just who won!”
“Right. Even in Orkney, bastion of reddish-pink voting, nearly a third of the votes were aquamarine.”
“So, how would you do it?”

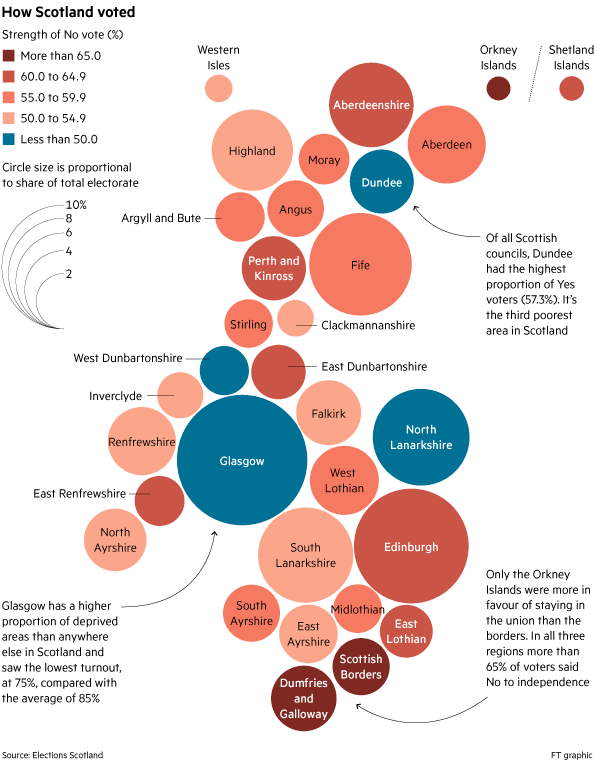
“Never mind how I’d do it: we can look at how some more reputable sources did. The FT do this curious circle thing - although it’s news to me that North Lanarkshire is to the north of Edinburgh. The Guardian splits each region up into squares representing 10,000 voters, which gives quite a clear representation.”
“So, we’ve to throw the book at the Mail and the Beeb?”
Beveridge picked up a volume of poems by McGonagall. “I’ve got just the thing.”
* Data visualisations from the BBC, the Guardian and the Financial Times.
* Edited 2014-09-24 to correct footnotes and a typo.