How do I decide whether to take things away from 1 (Normal distribution)
A student asks:
I’m never sure whether I have to take the number that comes out of the normal distribution table away from 1. How do you know?
It’s a familiar song: you’ve worked out your $z$-score (naturally, you remember that this means “how many standard deviations you are above the mean”, which translates directly into $z = \frac{x-\mu}{\sigma}$), looked it up in the big table and got a number out. It’s a probability. But which probability?
The trick is to look at your picture. You did draw a picture, didn’t you? Don’t roll your eyes. If you draw the picture and think for a moment, it becomes obvious.
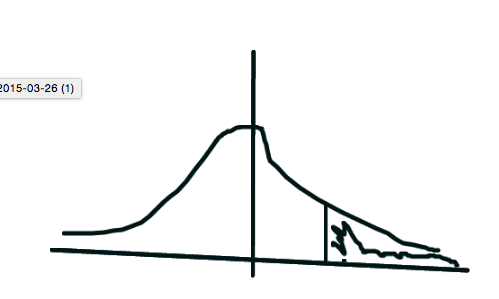
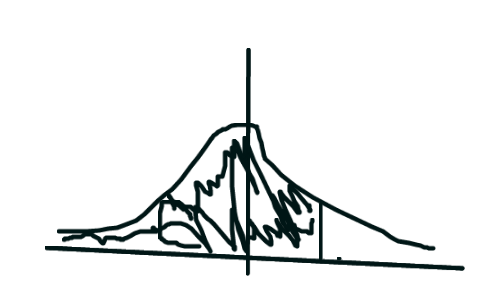
Notice that the two pictures are hardly contenders for whatever the art world’s equivalent of the Fields Medal is: they’re scribbled sketches, and that’s all you need. It’s just a line with a bump in the middle; ideally it ought to be symmetrical, but don’t worry about it. ((@reflectivemaths had the idea of creating a normal distribution stencil for just these situations, but I don’t know if anything came of it.))
Now, in the left situation, where we’re looking for $P(X > x)$ (let’s say), and $x$ is above the mean, you can see that the area we needed is less than a half. That means, the probability that comes out of the table is the wrong one: you need to take it away from one.
On the right, you’re looking for $P(X < x)$, and $x$ is still above the mean. In this case, the number you want is more than a half, so you leave the value from the table alone.
It’s that simple: if the value you want doesn’t fit with your picture, take it away from 1.